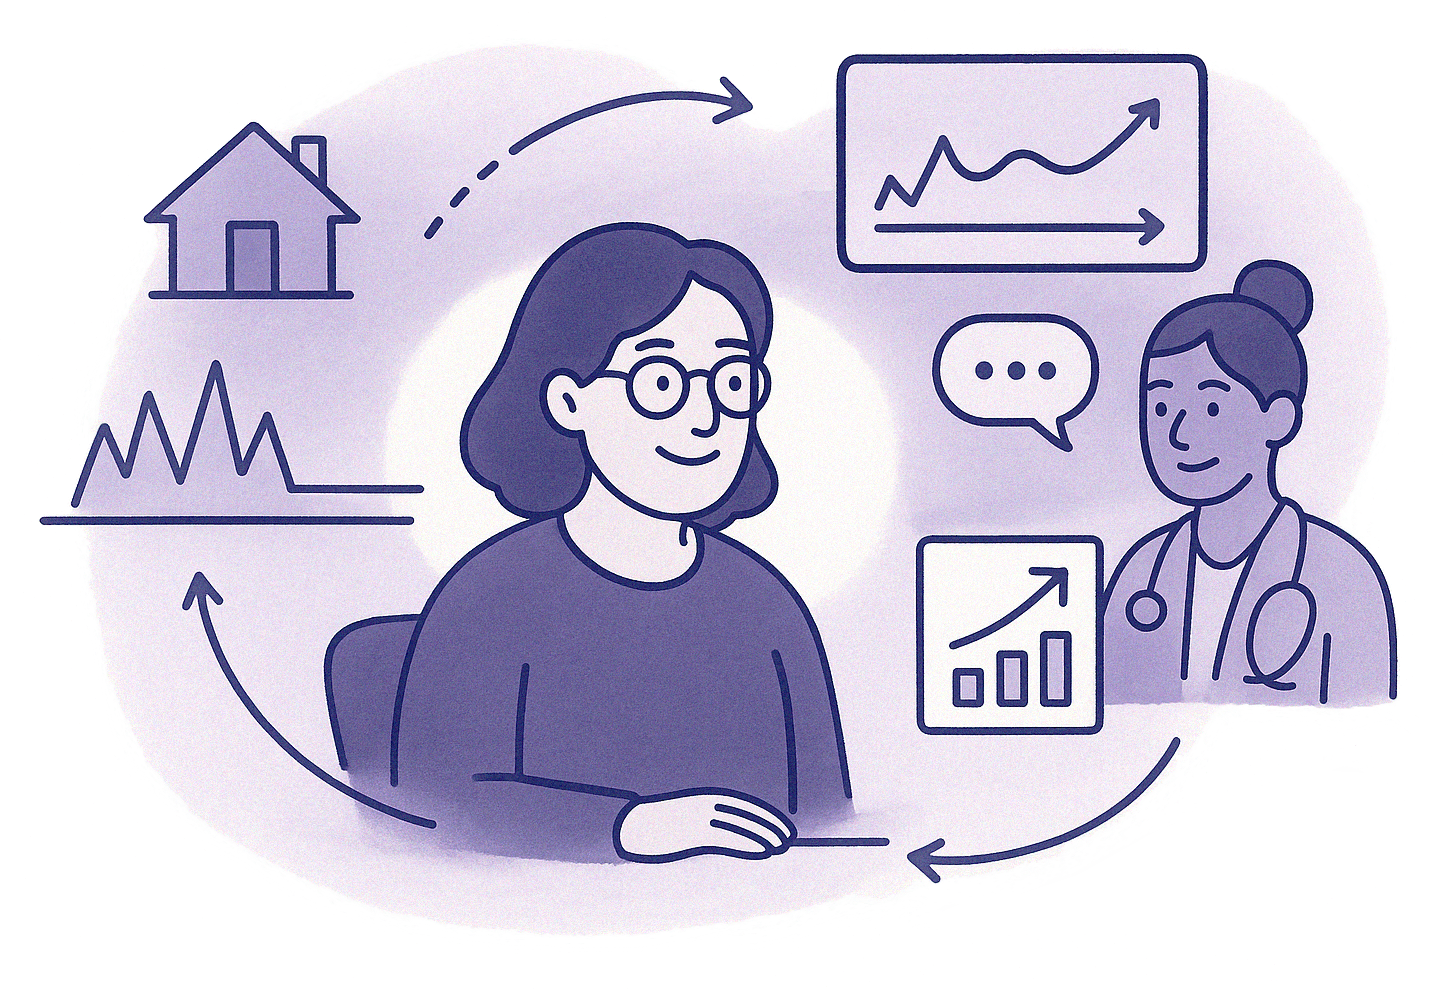
Population-Level Impact from Continuous Care
Senscio improves outcomes by keeping care moving continuously across days, conditions, and settings—not just at isolated encounters. The Intelligent Care Continuity System™ identifies drift early, prioritizes what matters now, and enables timely action before instability becomes avoidable utilization.
Below is a population-level view across three distinct groups: medically frail members, lower social-risk utilization-sensitive members, and members facing high socioeconomic complexity.
Rates shown are per 1,000 patients per day. “On” reflects members actively supported through Senscio’s continuous care model; “Off” reflects comparable periods without that continuity layer.
One continuity system. Different impact by population.
Different populations destabilize in different ways. Frailty, clinical complexity, behavioral drift, access gaps, and social friction each create distinct pathways to avoidable utilization.
Senscio’s Intelligent Care Continuity System™—Digital Twin for Health™ (DT4H™), HealthGraph™, and Ibis™—allows the same underlying platform to detect those different failure modes early and support the right kind of action for each population.
Across the full population, continuous care reduces avoidable utilization.
Before looking at how impact differs by subgroup, the broad result is clear: Senscio’s Intelligent Care Continuity System™ reduces avoidable utilization across the full population.
The sections below show how that impact expresses differently in medically frail, utilization-sensitive, and socioeconomically complex populations. But the topline pattern is consistent: earlier detection, better continuity, and more timely intervention reduce escalation, shorten cascades, and improve stability.
Rates shown are per 1,000 patients per day.
These outcomes do not come from blanket increases in human touch. They come from a system that continuously supervises the population, surfaces which members need attention and why, and enables the care team to intervene selectively where judgment and safety matter most.
Medically Frail Members
In medically frail populations, the goal is not to eliminate acute events—it is to prevent silent deterioration, intervene earlier, and reduce the length and intensity of avoidable admissions.
With continuous, intelligence-guided care delivered through the Intelligent Care Continuity System™ (DT4H™ + HealthGraph™ + Ibis™), the Care Continuity Team™ sees drift sooner and acts before it becomes a prolonged cascade.
Rates shown are per 1,000 patients per day.
Lower Social Risk, Utilization-Sensitive Members
Some populations appear clinically “stable” in episodic care but still generate preventable utilization due to delayed response, inconsistent routines, and fragmented guidance between encounters.
Senscio adds daily structure and reinforcement—helping members stay stable without unnecessary escalation.
Rates shown are per 1,000 patients per day.
High Socioeconomic Complexity
In socioeconomically complex populations, utilization is often driven by access gaps, behavioral barriers, and life friction—not physiology alone.
By modeling daily engagement and context in DT4H™, learning patterns in HealthGraph™, and operationalizing action through Ibis™, the team can intervene earlier and stabilize life context—not just clinical values.
Rates shown are per 1,000 patients per day.
Widening Impact Over Time
Over time, Senscio has supported a growing share of members entering through home health discharge pathways and other higher-acuity settings—populations with greater baseline instability and faster deterioration between encounters.
The model is state-dependent and risk-stratified. When members are actively engaged, the system has current information to detect drift, update state, and trigger timely intervention. When engagement lapses, those data-driven activations do not occur. As case mix shifts toward higher-acuity populations, the performance gap between engaged and unengaged states becomes more pronounced.
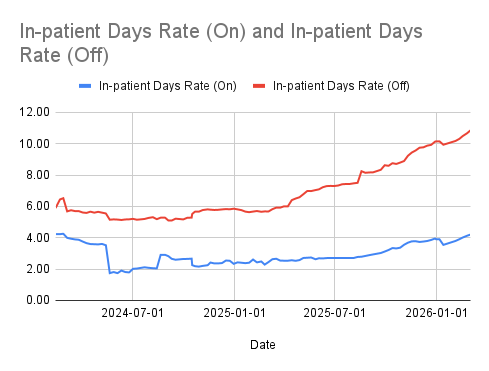
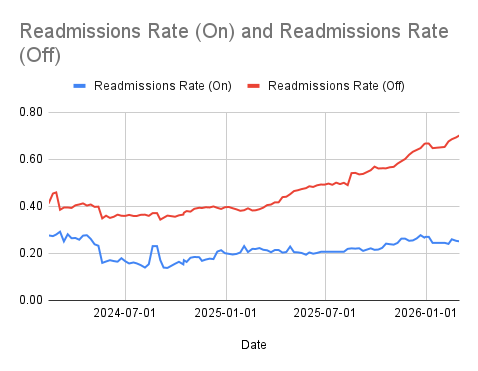
The widening separation in these curves reflects two realities: program impact and population shift. As we support a growing share of high-acuity, post-discharge members, baseline risk rises—yet the gap between engaged and unengaged states becomes more pronounced.
The difference is not increased staffing intensity. All members receive the same baseline human support, including structured monthly outreach and post-acute follow-up. The operational distinction is engagement. When members actively use Ibis™, HealthGraph™ has current data to reason with and can trigger timely, targeted interventions. When engagement lapses, those data-driven activations do not occur.
The result is both state-dependent and risk-stratified. As acuity increases, the marginal value of continuous, intelligence-guided care rises. Active engagement attenuates escalation, shortens cascades, and bends the trajectory of inpatient days and readmission burden over time.
Want to see how Senscio achieves these outcomes?
Explore the platform that powers DT4H™, HealthGraph™, and Ibis™—or book a demo to discuss deployment for your population.